


The moment a childcare operator goes from two sites to five, something quietly breaks. Not enrollment, not staffing — the numbers. Site A reports 94% occupancy. Site B reports 88%. The regional director pulls both into a board deck, and someone asks the obvious question: "Are these counting the same thing?"
Usually they aren't.
One director counts a child as "enrolled" the day the deposit clears. Another counts them the first day they physically show up. A third counts them the day the contract is signed, even if the start date is six weeks out. All three are reasonable. All three produce different occupancy numbers. And when you stack them into a single comparison, you get a report that looks precise but is actually meaningless.
This is the problem a canonical data model solves. Not fancy dashboards — those come later. The foundation is agreeing, in sometimes painful detail, on what each number means before you ever aggregate across sites. If you've already read through what dashboard KPIs actually move occupancy and retention, this article is the layer underneath: the definitions and plumbing that make those KPIs comparable across locations.
Why cross-site numbers drift (and why it's rarely anyone's fault)
The instinct is to blame the directors. "Why can't they just enter data the same way?" But the drift is structural, not personal.
Each site grew its own habits before there was a standard. A center that opened in 2019 built its enrollment tracking around one software's fields. A center acquired in 2023 came with spreadsheet logic baked in by a former owner. When corporate asks for a "monthly occupancy report," each site answers honestly — using its own private definition of occupancy.
-
Is a child on a two-week medical leave still "enrolled"?
-
Does a part-time child (three days a week) count as 1.0 or 0.6 toward capacity?
-
When a family gives notice on the 10th but the child attends through the 30th, which month owns the withdrawal?
-
Does a classroom temporarily closed for licensing count against occupancy or get excluded from the denominator?
None of these are exotic. They happen every month at every site. And because each site resolves them slightly differently, the aggregate rolls up wrong. A canonical data model for childcare reporting exists to answer these questions once, centrally, and force every site's raw data through the same interpretation.
The core idea: separate what's recorded from what's reported
There are two distinct layers, and mixing them is where operators go wrong.
Simplify your childcare center’s daily operations.
Totsyly helps you manage enrollments, staff, and communications efficiently so you can focus on care.
- Streamlined enrollment & waitlist management
- Automated billing & payment tracking
- Staff scheduling & attendance monitoring
No credit card required
Layer one is the raw record — the source events. A child was enrolled. A payment posted. An attendance was logged. A staff member clocked in. These are facts. They shouldn't be argued about.
Layer two is the metric definition — the rules that turn raw records into a reportable number. "Occupancy" is not a fact. It's a calculation you apply to attendance and capacity records using a specific set of rules.
The mistake is letting each site produce Layer-two numbers directly and then trying to reconcile them upstream. You can't. Once a site hands you "88% occupancy," you've lost the underlying records that would let you recompute it your way. The canonical approach flips that: every site sends clean raw records, and the central model computes every metric from a single set of rules.
That one architectural decision — pull raw events, compute centrally — solves most cross-site trust problems before you write a single query.
A childcare-specific data model: entities and canonical fields
Below is a working entity model that covers most center operations. The point isn't that your columns must match exactly — it's that every field needs one agreed definition, one owner, and one allowed set of values.
Core entities
| Entity | Purpose | Canonical key fields |
|---|---|---|
site | One physical location | siteid, sitename, licensedcapacity, regionid, open_date |
classroom | A room with an age band and ratio | classroomid, siteid, ageband, licensedcapacity, required_ratio |
child | A unique enrolled child | childid, siteid, dob, enrollmentstatus, scheduletype |
enrollment | A dated enrollment period | enrollmentid, childid, startdate, enddate, contracteddaysperweek, withdrawalreason |
attendance | One check-in/out event | attendanceid, childid, date, checkints, checkoutts, status |
staff | A person who can be scheduled | staffid, siteid, role, active_flag |
staff_shift | A scheduled/worked shift | shiftid, staffid, classroomid, date, scheduledstart, scheduledend, actualstart, actual_end |
invoice | A billed amount | invoiceid, childid, period, amountbilled, amountcollected, due_date |
The fields that cause the most trouble
-
enrollmentstatus— Allowed values must be a fixed list:active,pendingstart,onleave,withdrawn,waitlist. No free text. A site typing "starting soon" instead ofpendingstartwill break every rollup that filters on status. -
scheduletypeandcontracteddaysperweek— This is how you handle part-time equivalency. A full-time child is 1.0 FTE; a three-day child is 0.6 FTE (3/5). Whether occupancy uses headcount or FTE is a definition decision you make once. -
statuson attendance —present,absentexcused,absentunexcused,late,early_pickup. Attendance rate means nothing if one site logs no-shows as blank rows and another logs them asabsent. -
withdrawalreason— A controlled list (moved,cost,dissatisfaction,agedout,schedule_change,other) is the only way you'll ever produce a trustworthy churn analysis.
A few fields deserve special attention because they're where sites silently diverge:
Canonical metric definitions
This is the heart of it. Each metric gets a written definition, a numerator, a denominator, and a rule for the tricky cases. Here are the ones that matter most.
Occupancy rate > The ratio of filled capacity to licensed capacity over a period, measured in FTE.
-
Numerator
sum of active-enrollment FTE on each business day
-
Denominator
sum of licensed capacity on each business day (excluding days a classroom is licensed-closed)
-
Rule
pendingstartandonleavedo not count in the numerator. Licensed-closed classrooms are removed from both sides.
Attendance rate > Actual attended child-days divided by expected child-days, based on contracted schedule.
-
Numerator
count of attendance records where
status = 'present' -
Denominator
expected child-days from contracted schedule for that period
-
Rule
excused absences stay in the denominator (they were expected).
Net enrollment change > New starts minus withdrawals in a period, by site.
-
Rule
a withdrawal belongs to the month of the child's last attended day, not the notice date. This single rule ends most "your churn numbers don't match mine" arguments.
Collections rate > Amount collected divided by amount billed for a billing period.
-
Rule
measured against the original due date, not adjusted payment-plan dates, so restructured accounts don't quietly inflate the number.
The pattern matters more than any single metric. Every definition names what's included, what's excluded, and what happens in the awkward middle. If your definition doesn't handle the awkward middle, sites will handle it themselves — differently.
Sample SQL and aggregation rules
Definitions in a doc are nice. They only become trustworthy when they're expressed as the one query everyone runs. Here's a simplified occupancy calculation showing the FTE and licensed-closed logic in practice.
-- Daily FTE occupancy by site WITH dailycapacity AS ( SELECT c.siteid, d.calendardate, SUM(c.licensedcapacity) AS licensedcapacity FROM classroom c CROSS JOIN calendar d WHERE d.calendardate BETWEEN :periodstart AND :periodend AND NOT EXISTS ( -- exclude licensed-closed room-days SELECT 1 FROM classroomclosure cl WHERE cl.classroomid = c.classroomid AND d.calendardate BETWEEN cl.startdate AND cl.enddate ) GROUP BY c.siteid, d.calendardate ), dailyfilled AS ( SELECT e.siteid, d.calendardate, SUM(e.contracteddaysperweek / 5.0) AS filledfte FROM enrollment e CROSS JOIN calendar d WHERE e.enrollmentstatus = 'active' AND d.calendardate BETWEEN e.startdate AND COALESCE(e.enddate, :periodend) AND d.calendardate BETWEEN :periodstart AND :periodend GROUP BY e.siteid, d.calendardate ) SELECT cap.siteid, ROUND(SUM(fil.filledfte) / NULLIF(SUM(cap.licensedcapacity),0), 4) AS occupancyrate FROM dailycapacity cap LEFT JOIN dailyfilled fil ON fil.siteid = cap.siteid AND fil.calendardate = cap.calendardate GROUP BY cap.siteid;
Two things are doing the heavy lifting: the contracteddaysper_week / 5.0 gives you FTE instead of raw headcount, and the NOT EXISTS block keeps a temporarily closed room from dragging down a site that did nothing wrong. Whatever tool you use, the rule is the same — one query definition, versioned, run identically for every site. The instant two people compute occupancy with two different queries, you're back to square one.
ETL responsibilities: who owns what
The cleanest data model in the world falls apart if nobody's accountable for keeping the pipeline honest. Split the responsibilities clearly:
-
Site-level (director or admin) Ensure raw records are entered on time and use only allowed values. They own accuracy at the source — nothing more. They are explicitly not responsible for computing metrics.
-
Extract (automated) Pull raw entities nightly. No transformation here — just faithful copies of source records with timestamps.
-
Transform (central) Apply canonical definitions. Map any legacy field values to the controlled lists. Compute FTE, apply the withdrawal-month rule, exclude closed rooms.
-
Load & validate (central data owner) Land the modeled tables and run tolerance checks before anything reaches a dashboard.
-
Report (leadership/regional) Consume only from the modeled layer. Nobody builds a board number off a raw export or a site's private spreadsheet.
Make the modeled layer the fastest source of truth by automating nightly extracts and validation so sites stop using side spreadsheets.
The single biggest failure pattern in multi-site reporting is a regional manager quietly maintaining a side spreadsheet because they don't trust the central numbers. That spreadsheet becomes a competing source of truth, and now you have two versions of reality in the same meeting. Kill side spreadsheets by making the modeled layer faster and more trusted than the workaround — that's the only way to actually win that fight.
Tolerance checks: catching bad data before executives see it
Trust dies the first time a CEO catches a wrong number in a deck. Tolerance checks are the automated guardrails that stop that from happening. Run them at load time, and hold the report if any fail.
-
Occupancy sanity any site reporting over 105% occupancy → flag (usually a licensed-closed room not excluded, or a double-counted enrollment).
-
Attendance vs. enrollment reconciliation more
presentrecords than active enrollments on a given day → flag (a stale enrollment or a duplicate child record). -
Null-key check any core record with a missing
siteid,childid, or date → reject the row and log it. -
Value-domain check any
enrollment_statusoutside the allowed list → reject and alert the site. -
Period completeness a site submitting fewer business days than the calendar expects → flag (missing attendance uploads).
-
Collections drift collections rate swinging more than ~15 points month over month → flag for review, not auto-reject.
The point of a tolerance check isn't to be perfectly right — it's to make sure a human looks before the number becomes a slide. A flagged report that's held for a day beats a clean-looking report that's wrong.
A real scenario
A four-site preschool group — roughly 320 kids across all locations — kept fighting about occupancy in their monthly reviews. Regional numbers never matched what corporate calculated, and every meeting burned 20–30 minutes relitigating whose figure was right.
The root cause was mundane. Two sites counted part-time children as full seats; two used FTE. One site left withdrawn kids marked active for weeks because nobody had a habit of closing them out. When they moved to a single canonical model — FTE occupancy, last-attended-day withdrawal rule, closed rooms excluded — the group-wide number shifted from a claimed 92% down to a real 86%.
That drop stung. But the honest 86% was the number that mattered: it revealed one site sitting near 78% that everyone had assumed was fine. They shifted a marketing push there and recovered several seats over the next quarter. The reporting fix didn't just settle arguments — it pointed to money that was actually on the table. It also made staffing planning more honest, since ratio and coverage decisions like the ones in the staffing blueprint to stop ratio breaches and cut burnout only work when the underlying enrollment numbers are real.
Rollout cadence: how to introduce this without chaos
You cannot flip the whole organization to a canonical model overnight. The rollout itself is where most of these projects die — usually because leadership tries to launch a perfect model to all sites at once and drowns in edge cases.
-
Weeks 1–2 — Definitions lock. Get directors in a room and settle the awkward-middle rules. Write them down. This is political work, not technical work, and it's the part people skip.
-
Weeks 3–4 — Pilot on one site. Run the model against a single location's raw data. Compare to that site's old numbers and explain every difference. If you can't explain a gap, your rules aren't done.
-
Weeks 5–6 — Add a second, different site. Pick one that grew differently — ideally an acquisition with messy legacy fields. This is where mapping rules get stress-tested.
-
Weeks 7–8 — Full rollout with parallel run. All sites live, but keep the old reports running alongside for one cycle. Nobody makes decisions on the new numbers alone until they've matched (or been reconciled against) the old ones once.
-
Ongoing — Monthly definition review. Reserve 15 minutes each month to review flagged tolerance checks and decide whether any new edge case needs a rule. Definitions are living; treat them that way.
The parallel run in step four is non-negotiable. Executives trust numbers they've watched reconcile with their own eyes. Skip it and you'll spend the next six months defending the model instead of using it.
When this is worth it — and when it isn't
Two sites where the directors talk daily? A full canonical model is probably overkill. You can settle discrepancies with a phone call, and the overhead of building and maintaining the pipeline won't pay for itself.
It starts making sense around three to four sites, or the moment a regional layer appears between corporate and the centers. That's when informal reconciliation stops scaling and someone inevitably starts keeping a shadow spreadsheet. It becomes essential the moment you're making capital or staffing decisions off cross-site comparisons — because a wrong number there costs real money. The broader operational shifts that come with growth are worth reading alongside this; the playbook for scaling multi-site childcare without quality loss covers how reporting fits into the larger picture of running more locations.
Visualize this cadence:
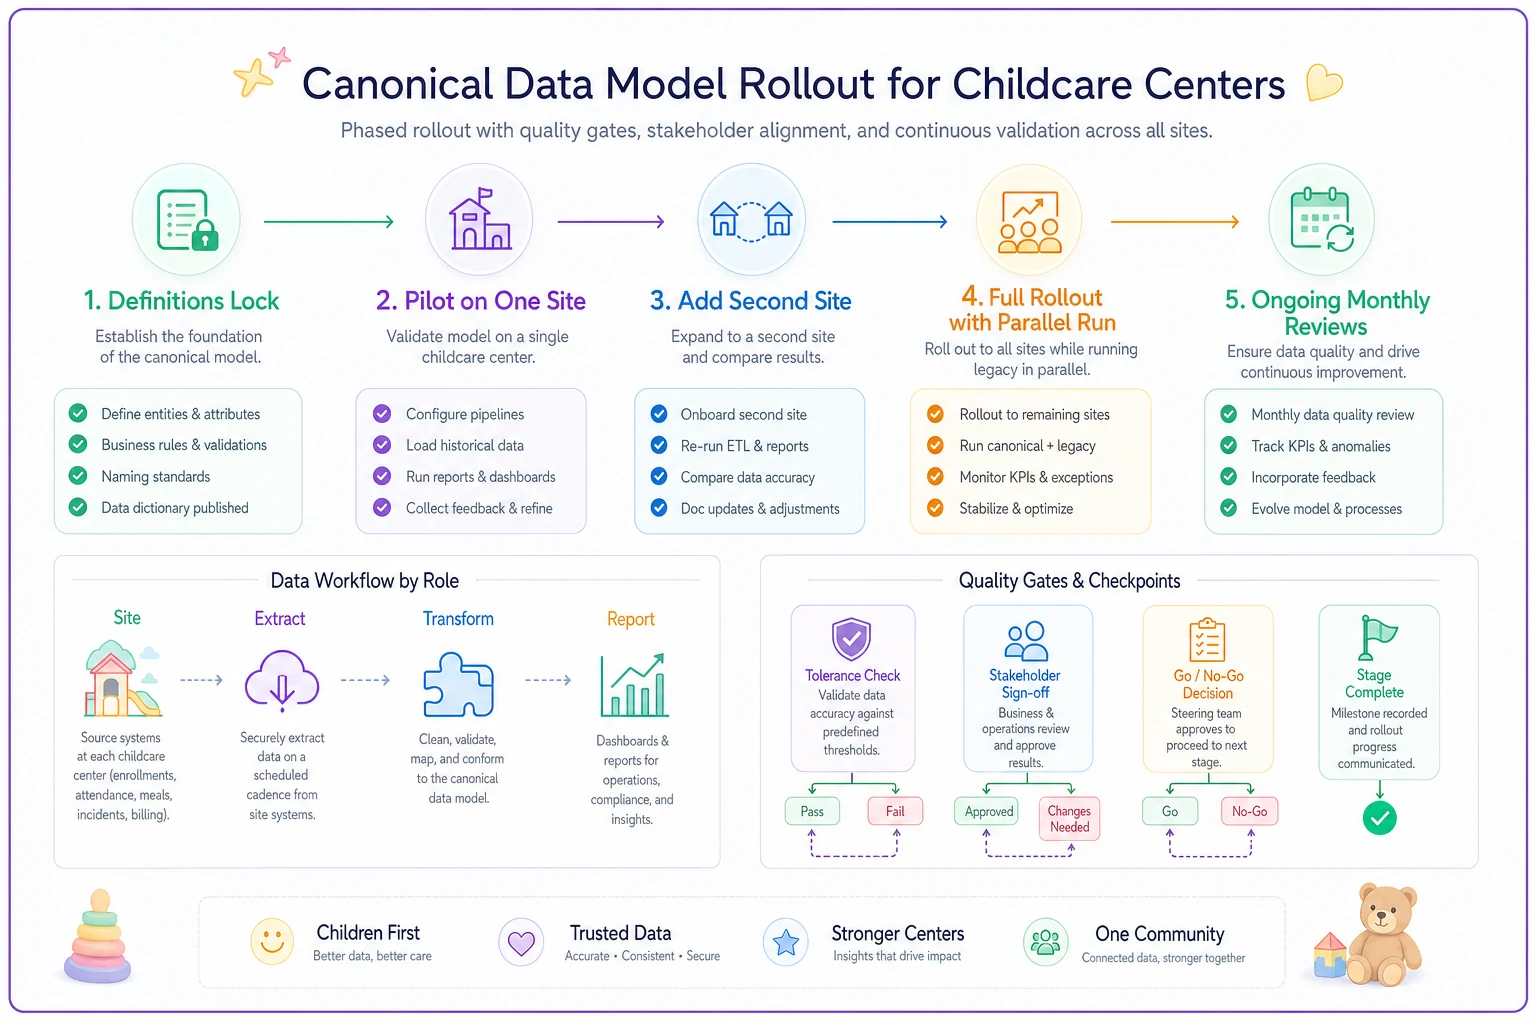
Use the visual to align stakeholders during the pilot and the parallel run.
Where software fits — quietly
Most of this can technically be done in spreadsheets. It just doesn't hold together past a few sites, because the manual mapping and tolerance-checking becomes a part-time job for someone. Operational platforms with built-in reporting help mainly by enforcing the controlled value lists at entry (so enrollment_status can't drift), running the extract and tolerance checks automatically each night, and computing metrics from one central definition instead of one query per site.
AI-assisted validation is genuinely useful for one specific thing: flagging anomalies a fixed rule would miss — a site whose attendance pattern quietly shifted, or a withdrawal spike that doesn't match its enrollment trend — and surfacing it before it hits a report.
The software is downstream of the thinking, though. No tool will decide for you whether a three-day child is 0.6 or 1.0. That's a definition you have to own. Get the definitions right first; the automation just keeps them from eroding.
The real payoff
A canonical data model for childcare reporting isn't really a data project. It's an agreement — a written, enforced understanding of what your organization means when it says "occupancy" or "churn" or "collections." The SQL and ETL are just how you make that agreement impossible to quietly break.
The centers that get this right stop arguing about numbers in meetings and start arguing about decisions, which is the argument you actually want to be having. When every site's data flows through the same definitions, the same queries, and the same tolerance checks, a comparison between two locations finally means something — and leadership can act on it without wondering whether they're comparing apples to something that just looks like an apple.
The centers that get this right stop arguing about numbers in meetings and start arguing about decisions, which is the argument you actually want to be having. When every site's data flows through the same definitions, the same queries, and the same tolerance checks, a comparison between two locations finally means something — and leadership can act on it without wondering whether they're comparing apples to something that just looks like an apple.
Ready to elevate your childcare management?
Join hundreds of childcare providers using Totsyly to save time, improve communication, and grow their centers.