


Most multi-site childcare operators don't fail because they lack data. They fail because nobody decided, in advance, what number forces a conversation and who has to be in the room when it does.
You can have a beautiful dashboard showing occupancy, ratio compliance, staff turnover, and tuition aging across twelve centers — and still watch a single location quietly drift into a licensing problem for four months because "someone was keeping an eye on it." The dashboard was never the issue. The missing piece was a governance layer: a set of thresholds, tolerance bands, and escalation paths that convert a yellow cell on a spreadsheet into a decision with an owner and a deadline.
That's what this article is about. Not KPIs — those are covered well elsewhere. This is the operating model that sits on top of the metrics and tells your directors, regional managers, and board what to do when a number moves. If you run three centers today and plan to run fifteen, this is the scaffolding that keeps quality from eroding as you scale.
Why portfolios drift even when the data is good
A single center is run by proximity. The director walks the floor, hears the tone in a classroom, notices the lead teacher looks exhausted, and fixes things before they show up in any report. That instinct doesn't scale. By the time you're at five or more sites, nobody has proximity to everything, and the organization has to replace "someone noticed" with "the system flagged it and someone was required to respond."
The pattern that actually breaks portfolios: metrics get reported but not governed. A regional director sees that Center 4 is at 71% occupancy. Is that a problem? Depends. If the target is 85% and the tolerance band is ±5 points, then 71% is well outside the band and should have triggered action weeks ago. But if there's no defined band and no trigger, 71% is just a number someone mentions in a meeting, nods at, and moves past.
Drift happens in the gap between "we can see it" and "we're required to act on it." The larger the portfolio, the wider that gap gets — the volume of yellow and amber signals exceeds what any one person can mentally track. Governance closes it by deciding ahead of time which signals are allowed to be ignored and which are not.
A second failure mode: everything escalates to the operator. When there's no ladder, every problem either gets buried at the site level or dumped on the CEO. Neither works long-term. A good operating model defines who resolves what at which level, so the board only sees the handful of decisions that genuinely need board attention.
The three layers of a childcare operating model
Think of the model as three stacked layers. Each has a different job, a different cadence, and a different owner.
Simplify your childcare center’s daily operations.
Totsyly helps you manage enrollments, staff, and communications efficiently so you can focus on care.
- Streamlined enrollment & waitlist management
- Automated billing & payment tracking
- Staff scheduling & attendance monitoring
No credit card required
| Layer | Owns | Cadence | Primary question |
|---|---|---|---|
| Site operations | Daily execution, ratio compliance, incident response | Daily / weekly | "Are we safe and staffed today?" |
| Regional / portfolio | SLO performance, trend detection, cross-site patterns | Monthly | "Which centers are drifting and why?" |
| Board / governance | Capital, risk appetite, structural decisions | Quarterly | "Are we exposed, and is the model working?" |
The mistake most growing operators make is collapsing these layers. The monthly regional review becomes a status update instead of a decision meeting. The quarterly board session turns into a performance recap instead of a governance checkpoint. When the layers blur, nothing gets decided — things just get discussed, repeatedly, until a crisis forces action.
Defining SLOs and tolerance bands gives each layer a clean filter. Site level handles anything inside the tolerance band. The moment a metric breaches the band, it becomes a regional decision. When a breach is severe or sustained, it climbs to the board. That filtering is what keeps the board out of the weeds and keeps real problems from stalling at the bottom.
SLOs and SLAs for childcare — and why the band matters more than the target
People borrow SLO/SLA language from software and then use it wrong. They write a target ("95% ratio compliance") and stop there. A target with no tolerance band and no response obligation is just a wish. The useful structure has four parts:
-
The metric — precisely defined, with one agreed formula. This is where a shared canonical data model for multi-site reporting does real work — if Center 2 and Center 7 calculate "occupancy" differently, your tolerance bands are meaningless.
-
The target — the number you're managing toward.
-
The tolerance band — the range you'll accept without action.
-
The decision trigger — what has to happen, and who has to do it, when the band is breached.
> SLO: Licensed ratio compliance > Metric: % of classroom-hours per week where staff-to-child ratio met or exceeded the licensed minimum, measured from attendance + scheduling records. > Target: 100%. > Tolerance band: ≥ 99.5% weekly per site. > Yellow trigger (99.0–99.4%): Director submits root-cause note at next weekly check-in. No escalation. > Red trigger (< 99.0%, or any single breach > 15 minutes): Same-day notification to regional director. Written corrective action within 48 hours. Logged to portfolio risk register. > Board threshold: Any site with two consecutive red weeks, or any ratio breach involving an incident, surfaces in the quarterly packet.
Notice what that does. It doesn't just measure ratio — it decides, in advance, who gets a notification at 4pm and who reads about it three months later. The band separates normal noise (one short breach during a chaotic pickup) from a pattern that signals understaffing.
A few SLOs worth defining this way across a portfolio:
-
Ratio compliance (safety-critical, tight band, fast escalation)
-
Occupancy vs. licensed capacity (financial, wider band, monthly cadence)
-
Tuition aging / collections rate (cash, banded by days overdue)
-
Staff turnover rate (leading indicator, trailing 90-day window)
-
Incident reporting timeliness (compliance, measured in hours-to-file)
-
Enrollment pipeline conversion (growth, monthly trend band)
Not every metric needs a tight band. Ratio compliance gets a razor-thin one because the downside is catastrophic. Occupancy gets a wider one because short-term fluctuation is normal and over-reacting to it tends to cause worse decisions than tolerating it. Getting the width of the band right matters more than getting the target exactly right — a too-tight band on a noisy metric trains everyone to ignore the alarms.
Tolerance bands: green, yellow, red, and what each color obligates
Color-coding a dashboard is easy. The discipline is attaching an obligation to each color so it isn't decorative.
-
Green (inside band) No action required. Explicitly — nobody has to explain green. This matters because it protects attention. If your regional reviews spend time on green metrics, you're burning the one scarce resource governance is supposed to protect.
-
Yellow (early breach) Owned at the site or regional level. Requires a written reason and a watch flag, but no escalation yet. Yellow is where you catch drift before it becomes a problem.
-
Red (band breach) Triggers escalation up one level, a defined response window, and an entry in the risk register. Red is not "bad" — red means the system is working and surfacing something that needs a decision.
Portfolios that scale cleanly tend to be strict about two things: green requires nothing, and red requires something specific and time-bound. The ones that struggle blur yellow and red, so either everything feels urgent or nothing does.
One calibration note worth taking seriously — review band widths quarterly against actual variance. If a metric sits yellow 40% of the time, the band is too tight or the target is wrong. Bands that fire constantly get tuned out, and a muted alarm is worse than no alarm at all.
The escalation ladder
An escalation ladder answers one question: when a trigger fires, who handles it and when does it climb? Without a written ladder, escalation defaults to personality — the loudest problem or the most anxious manager gets attention, and quiet problems rot.
| Rung | Owner | Handles | Must escalate when… |
|---|---|---|---|
| 1 | Center Director | Yellow triggers, single-site operational issues | Red trigger fires, or issue unresolved in 5 business days |
| 2 | Regional Director | Red triggers, cross-site patterns, corrective action plans | Breach persists 2+ cycles, or involves licensing/safety risk |
| 3 | Operations Lead / COO | Systemic issues, multi-site breaches, policy gaps | Material financial, legal, or reputational exposure |
| 4 | Board / Governance | Risk-appetite decisions, capital, structural change | — |
Two rules make a ladder work. First, every rung has a time limit — an issue that sits at Rung 1 for a week without resolution auto-climbs to Rung 2 whether or not the director flags it. The clock does the escalating, not the ego. Second, escalation is not blame. If directors believe climbing the ladder reflects badly on them, they'll hide problems until they explode. The healthiest portfolios treat a well-escalated red as good management, not failure.
A quick example of how this runs in practice: a ratio breach fires red on a Tuesday afternoon. The director logs the cause (two callouts, substitute no-show) by end of day. A corrective action note is due within 48 hours. If the same site goes red again the following week, the clock trips Rung 2 automatically and the regional director now owns a staffing root-cause review — not a one-off patch. If the breach is tied to an incident, it skips straight toward the board threshold. No one had to remember to escalate. The rules did it.
Meeting cadence: monthly operations, quarterly governance
Most portfolios meet too often about the wrong things and too rarely about the right ones. The cadence should match the layer.
Monthly regional operations review (60–75 minutes). This is a decision meeting, not a report-out. The agenda should be built entirely around breaches and trends — green metrics don't get airtime.
-
Red items since last meeting (10 min) — each with owner, status, and close date. Anything still open gets a decision today.
-
Yellow drift watch (10 min) — metrics trending toward red; decide whether to intervene now or keep watching.
-
Cross-site patterns (15 min) — is turnover climbing in one region? Are three sites missing the same enrollment target? This is where portfolio-level insight lives.
-
SLO performance snapshot (10 min) — band compliance by site, exceptions only.
-
Decisions and owners (15 min) — explicit list of what was decided, who owns it, by when.
Quarterly board / governance session (90 min). This is where structural and risk-appetite questions get answered. It leans heavily on financial trajectory — which is why the board packet should connect operating data to your multi-year financial model and reserve policy, not just show a snapshot of last quarter. The board's job isn't to manage centers; it's to decide whether the model is holding as you grow.
The single biggest cadence mistake is letting the monthly meeting become a recap of the dashboard. If your regional review could be replaced by an email, it's not a governance meeting — it's a status update wearing a meeting's clothes. The test is simple: did anyone leave with a new obligation and a deadline? If not, it didn't need to happen.
The board-ready packet: what directors should actually see
Boards drown in detail and starve for decisions. A good packet does the filtering for them — it surfaces the small number of items that genuinely need governance-level judgment and leaves everything else at the operating layer.
-
One-page portfolio health summary — SLO compliance by site, color-coded, exceptions called out.
-
Risk register extract — open red items, age, owner, and trajectory. Age matters more than count; three reds that are two weeks old is fine, one red that's been open eight weeks is the real story.
-
Decision requests — explicit items requiring a board vote or guidance, each with options and a recommendation. This is the heart of the packet.
-
Financial trajectory — occupancy, revenue per site, and reserves against policy, tied to the financial model.
-
Leading indicators — staff turnover and enrollment pipeline, because these predict next quarter's problems. For the enrollment and retention side specifically, the metrics worth trending are covered in this breakdown of the dashboard KPIs that actually move occupancy and retention.
The packet should define board decision thresholds explicitly — the dollar figures, risk categories, and compliance events that require board involvement rather than leaving it to judgment. For example: any single capital expenditure above a set threshold, any licensing event that could affect a center's operating permit, any safety incident meeting a defined severity level. When thresholds are written down, directors stop getting surprised and operators stop guessing about what to bring forward.
A realistic before-and-after
Consider a mid-sized operator running eight centers, growing toward twelve. Before putting a governance layer in place, monthly regional meetings ran close to two hours and mostly consisted of each director narrating their own numbers. Problems that should have been caught early tended to surface only after they'd become expensive. One center sat below 72% occupancy for most of a quarter before anyone treated it as a decision rather than a recurring complaint. A staffing shortfall at another site produced a string of short ratio breaches that nobody connected until a licensing visit raised it.
After defining SLOs with tolerance bands, writing a four-rung escalation ladder, and restructuring the monthly meeting around breaches only, the meeting dropped to about an hour and actually produced decisions. The under-occupied center's drift tripped a red trigger within the first two weeks instead of the second month, which meant the intervention — adjusted pricing and a targeted enrollment push — started a full quarter earlier. The clustered ratio breaches auto-escalated after the second red week and surfaced a scheduling root cause before it reached a licensor.
Nothing here is magic. The improvement is structural: problems got caught earlier and owned faster, which over a year is the difference between managing a portfolio and reacting to one.
When this level of governance makes sense — and when it doesn't
When it makes sense: You're running roughly four or more centers, or you're at three and actively acquiring. At that size, proximity has already failed and you need the system to do the noticing. It's also worth building out if you've taken on outside capital or a formal board, since governance-grade reporting isn't optional once someone else's money is involved.
When it's overkill: A single center, or two centers under one hands-on owner-director. Formal SLO bands and escalation ladders add overhead that a tight, proximate team doesn't need yet. Forcing this structure too early just creates paperwork and meetings that slow you down without catching anything your own eyes don't already catch.
Who should not do this yet: Operators who haven't standardized their metric definitions across sites. If "occupancy" and "ratio compliance" are calculated differently at different centers, your tolerance bands compare apples to oranges and your escalations fire on noise. Fix the shared data definitions first. The governance layer is only as trustworthy as the numbers underneath it.
Where software quietly carries the load
None of this requires fancy tooling to design — you can draft SLOs, bands, and ladders in a document today. Sustaining it across a growing portfolio is where things get hard, because the discipline depends on triggers firing reliably and automatically. If escalation depends on a human remembering to check a spreadsheet and send an email, it will fail on the busy weeks — which are exactly the weeks problems cluster.
This is the part of the workflow where the design of your governance model meets the reality of running it day-to-day:
Metric updated → band check runs automatically → green: no action / yellow: watch flag created / red: escalation triggered → time limit clock starts → unresolved: auto-climbs one rung → board threshold met: added to quarterly packet
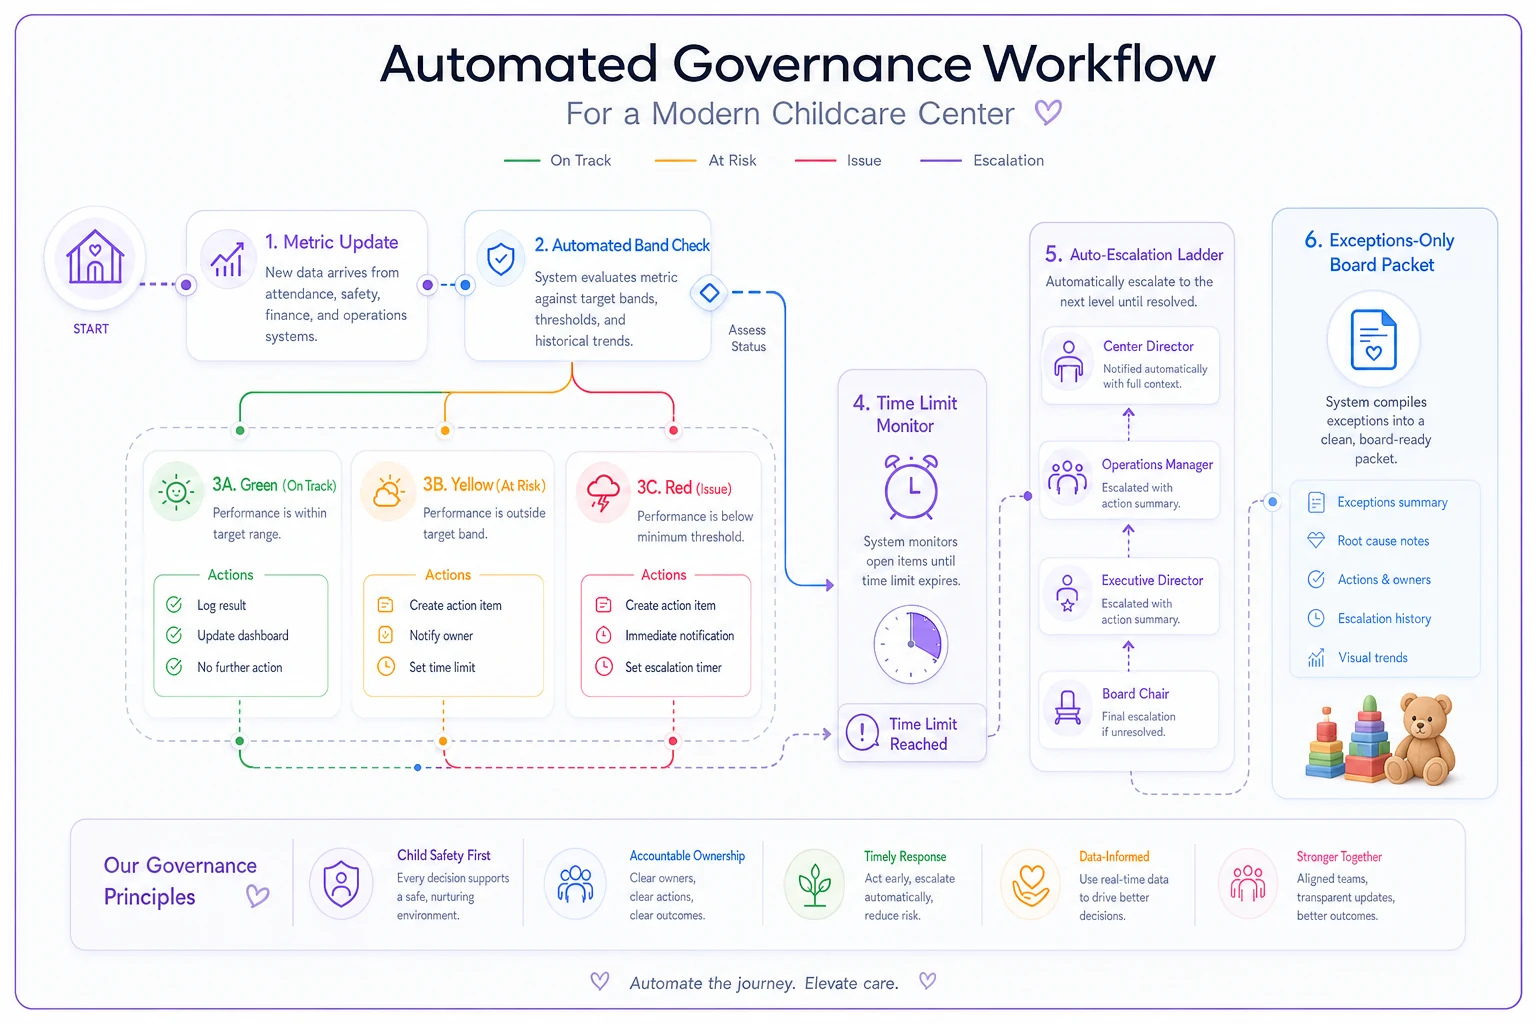
Automate band checks and the time-limit clock so escalations and auto-climbs run without manual steps.
An operational platform with AI automation handles this loop without anyone managing it manually. It watches the metrics continuously, fires yellow and red triggers without anyone remembering to, auto-climbs the escalation ladder when a time limit passes, and assembles the exceptions-only board packet instead of someone rebuilding it by hand every quarter. The governance model is yours; the automation just makes sure the rules actually run when attention is thin. That's the difference between a governance model that looks good in a binder and one that genuinely holds as you scale.
A multi-site childcare operating model isn't a dashboard and it isn't a list of KPIs. It's the decision layer that sits on top of your metrics — tolerance bands that separate noise from signal, escalation ladders that route problems to the right owner on a clock, a meeting cadence that produces decisions instead of recaps, and board thresholds that keep governance focused on the handful of choices that actually matter.
Build it before you need it. The operators who struggle most are the ones who try to install governance in the middle of a crisis, when there's no time to calmly decide what a band should be or who owns which rung. Set the triggers while things are calm, write them down, and let the structure do the noticing your own two eyes no longer can.
Ready to elevate your childcare management?
Join hundreds of childcare providers using Totsyly to save time, improve communication, and grow their centers.